Build your first workflow#
GRAPEVNE Builder is the graphical interface that assists you in graphing, manipulating and building GRAPEVNE workflows.
This tutorial will provide a quick introduction to the GRAPEVNE graphical interface (see Installation instructions) that will include how to construct, build and run a simple workflow using several modules that are already available online.
For this tutorial we will download, process and visualise some publically available Covid-19 data.
Loading modules#
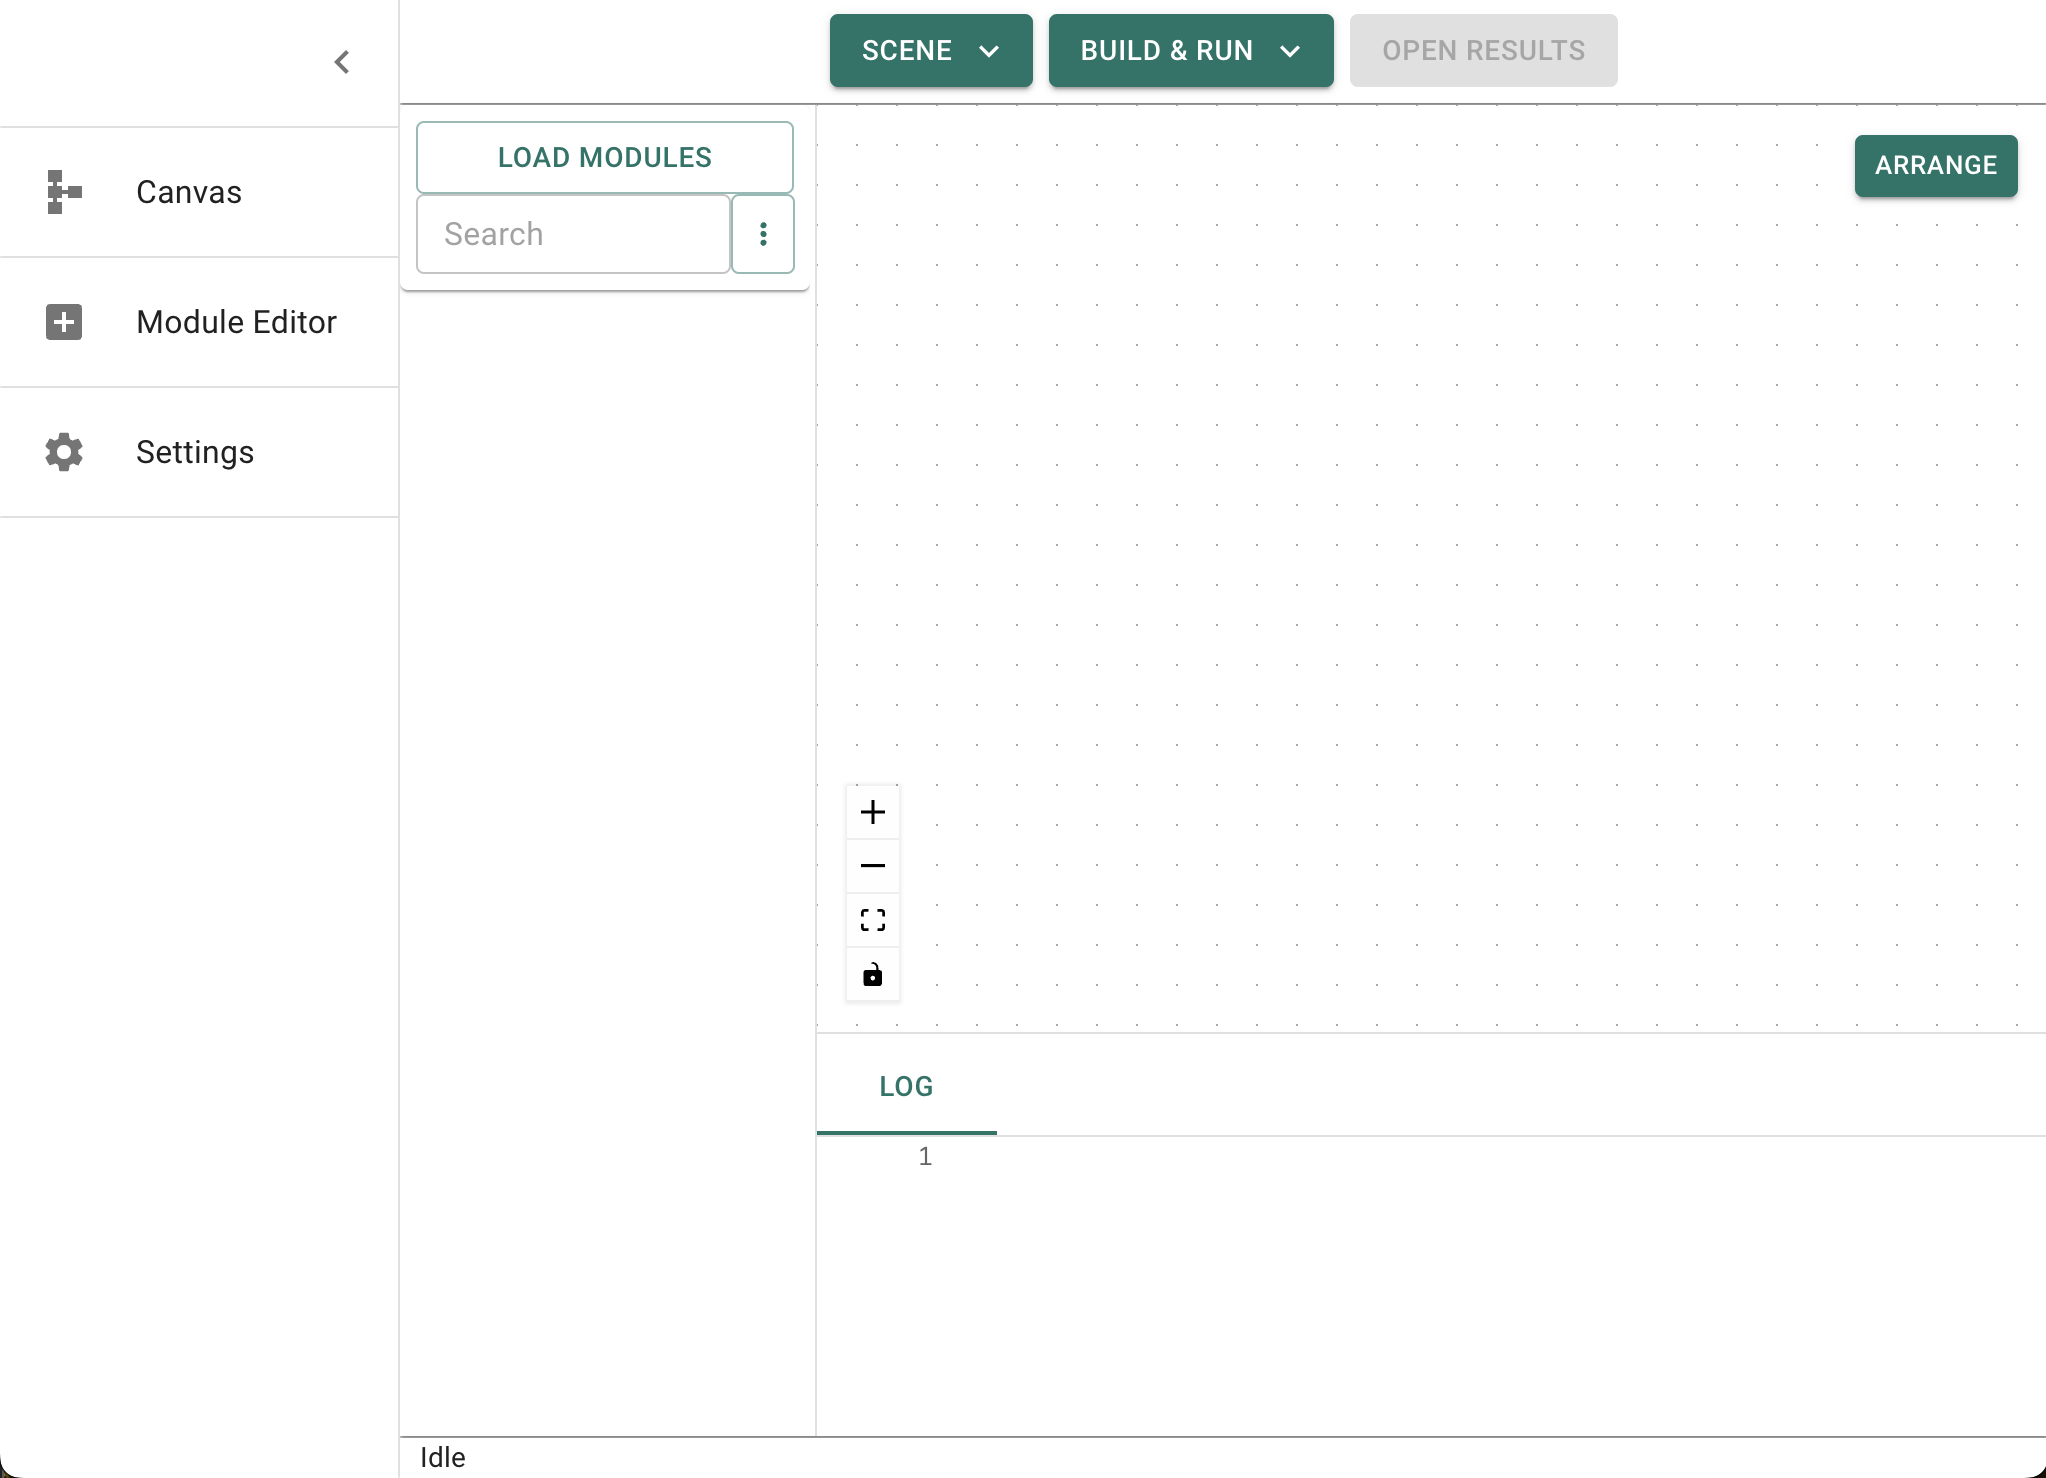
To begin, open GRAPEVNE. This should start the application in the ‘Builder’ screen, where you will construct and test-run your workflows.
There are various options available at the top of the screen. For this tutorial we will make use of pre-constructed modules available through our online repository. This should be the default setup if you have just installed GRAPEVNE, but you can check the repository list by clicking on the Settings option from the sidebar.
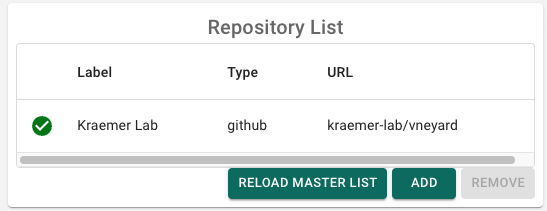
To access the repository ensure that kraemer-lab/vneyard (note the spelling) is available and active in the repository list. You can click Reload Master List to store the repository list to defaults if necessary.
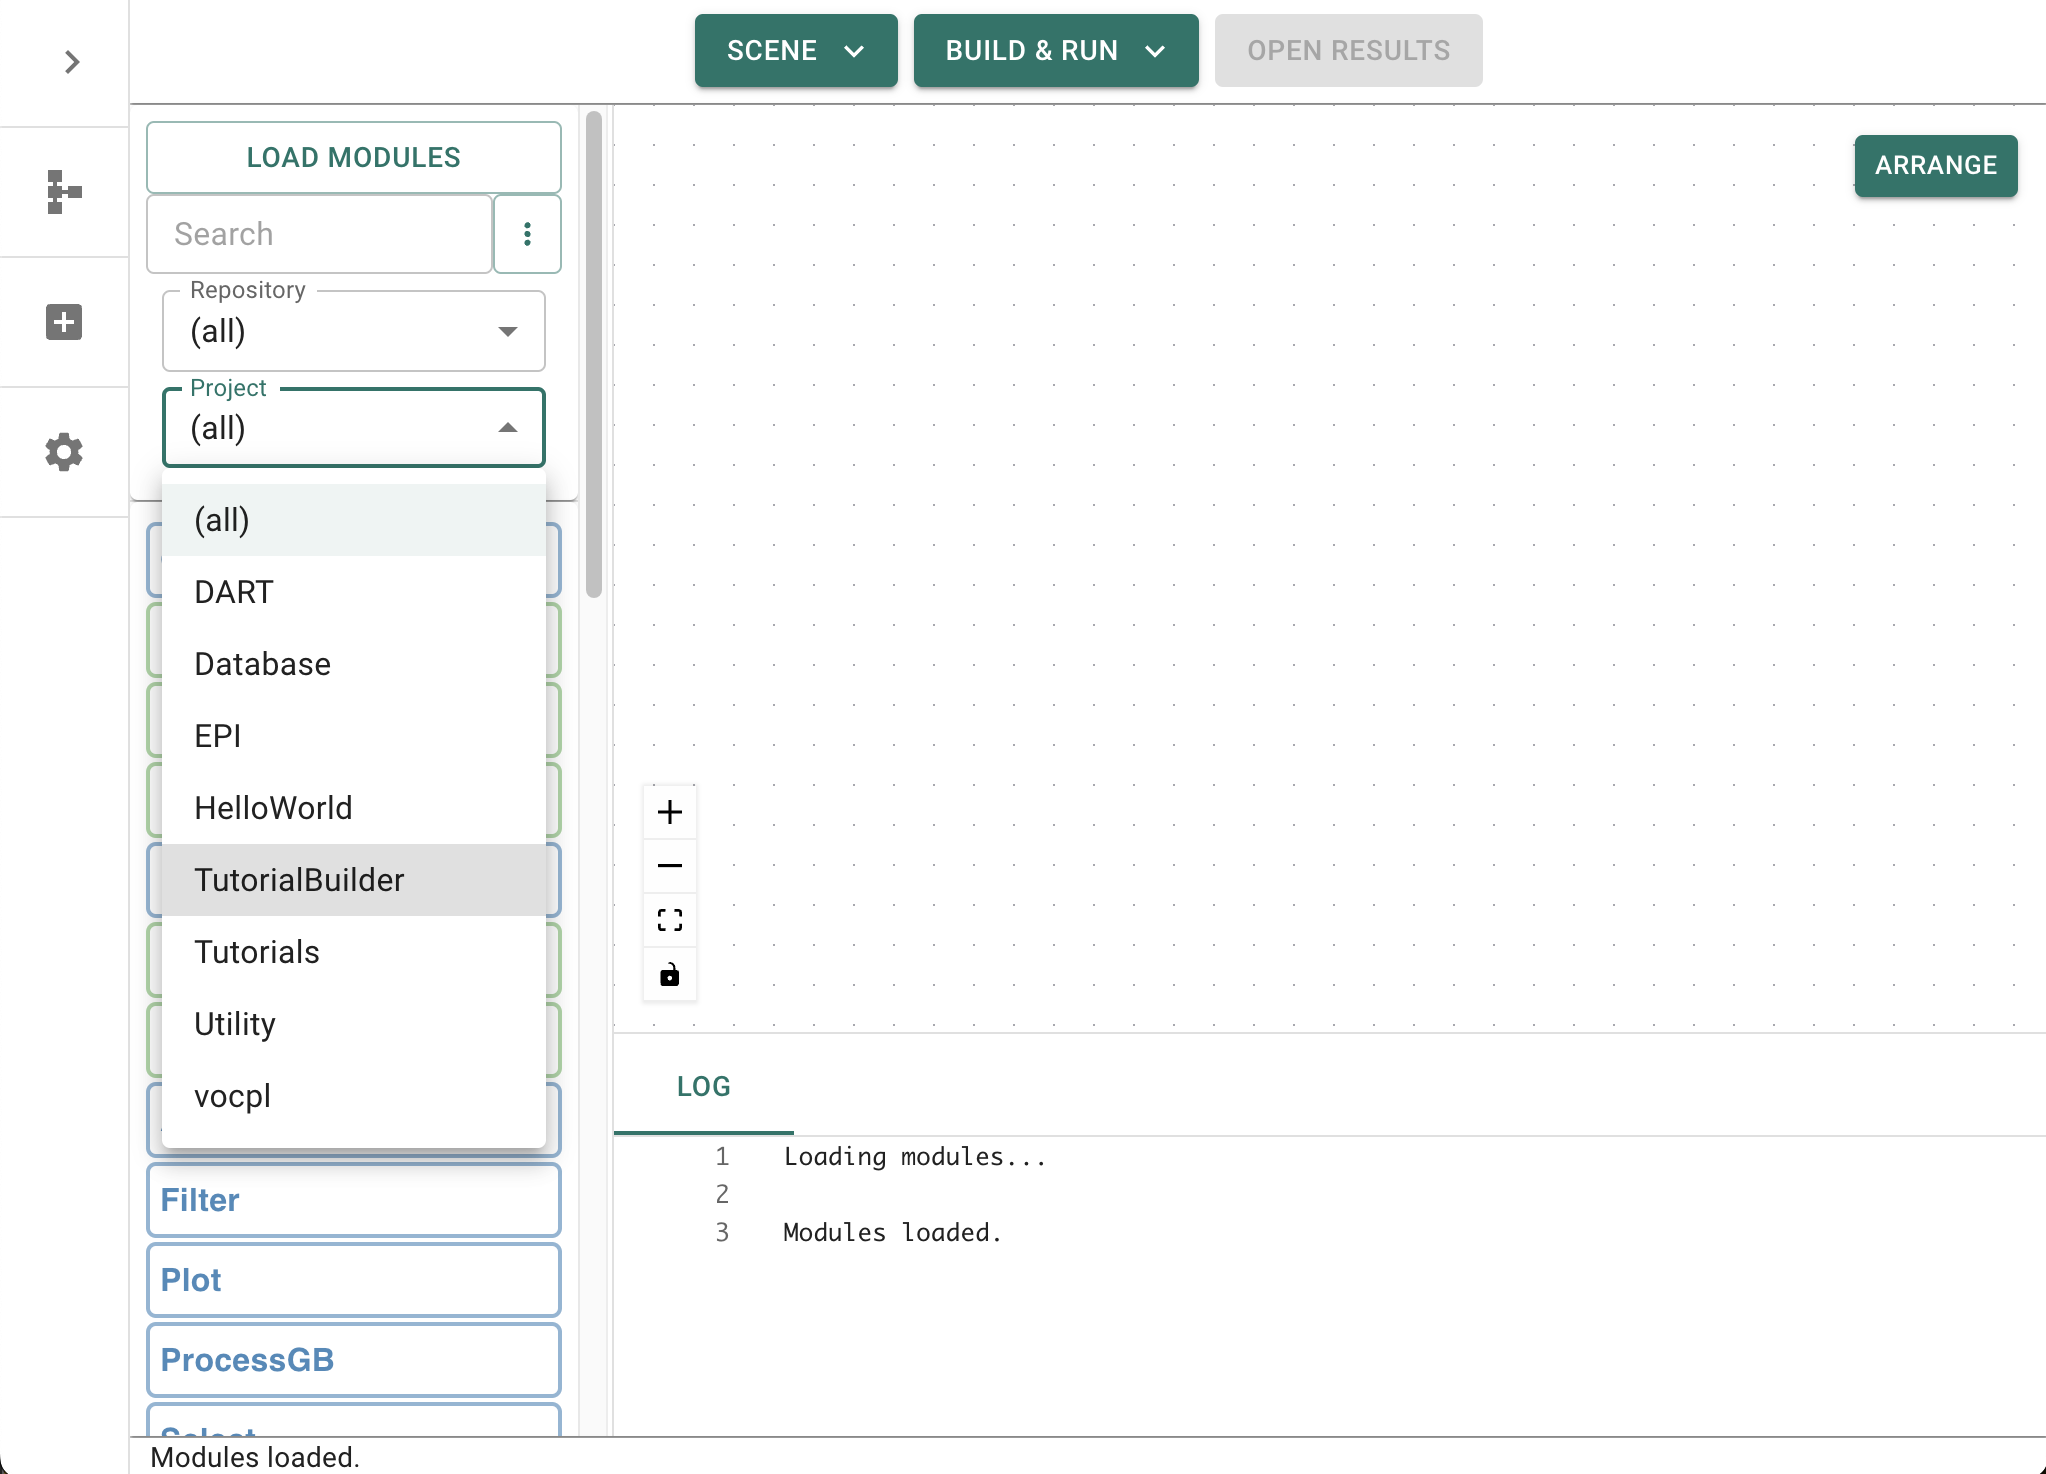
Return to the main (‘builder’) screen, and click Get Module List. A message (Loading remote modules) will display while the listing loads. This will take a few seconds and you will know when it completed as the list of available modules will display on the left-hand side of the screen.
The module list is filterable - for this session we are interested in only the Tutorial Builder modules, so select this from the filter drop-down box (which is currently displaying (all)).
Adding your first module#
In this tutorial we are interested in the number of new cases of Covid-19 that were reported to the World Health Organisation (WHO) at different times and across different countries. In particular, we will visualise the number of new cases reported for a single country across all available time periods, and then aggregrate these cases by month in order to assess for seasonal dependencies. Please note that this is being used as an example pipeline and does not take into account many factors including government restrictions and inter-annual variability that will affect the interpretation of these results.
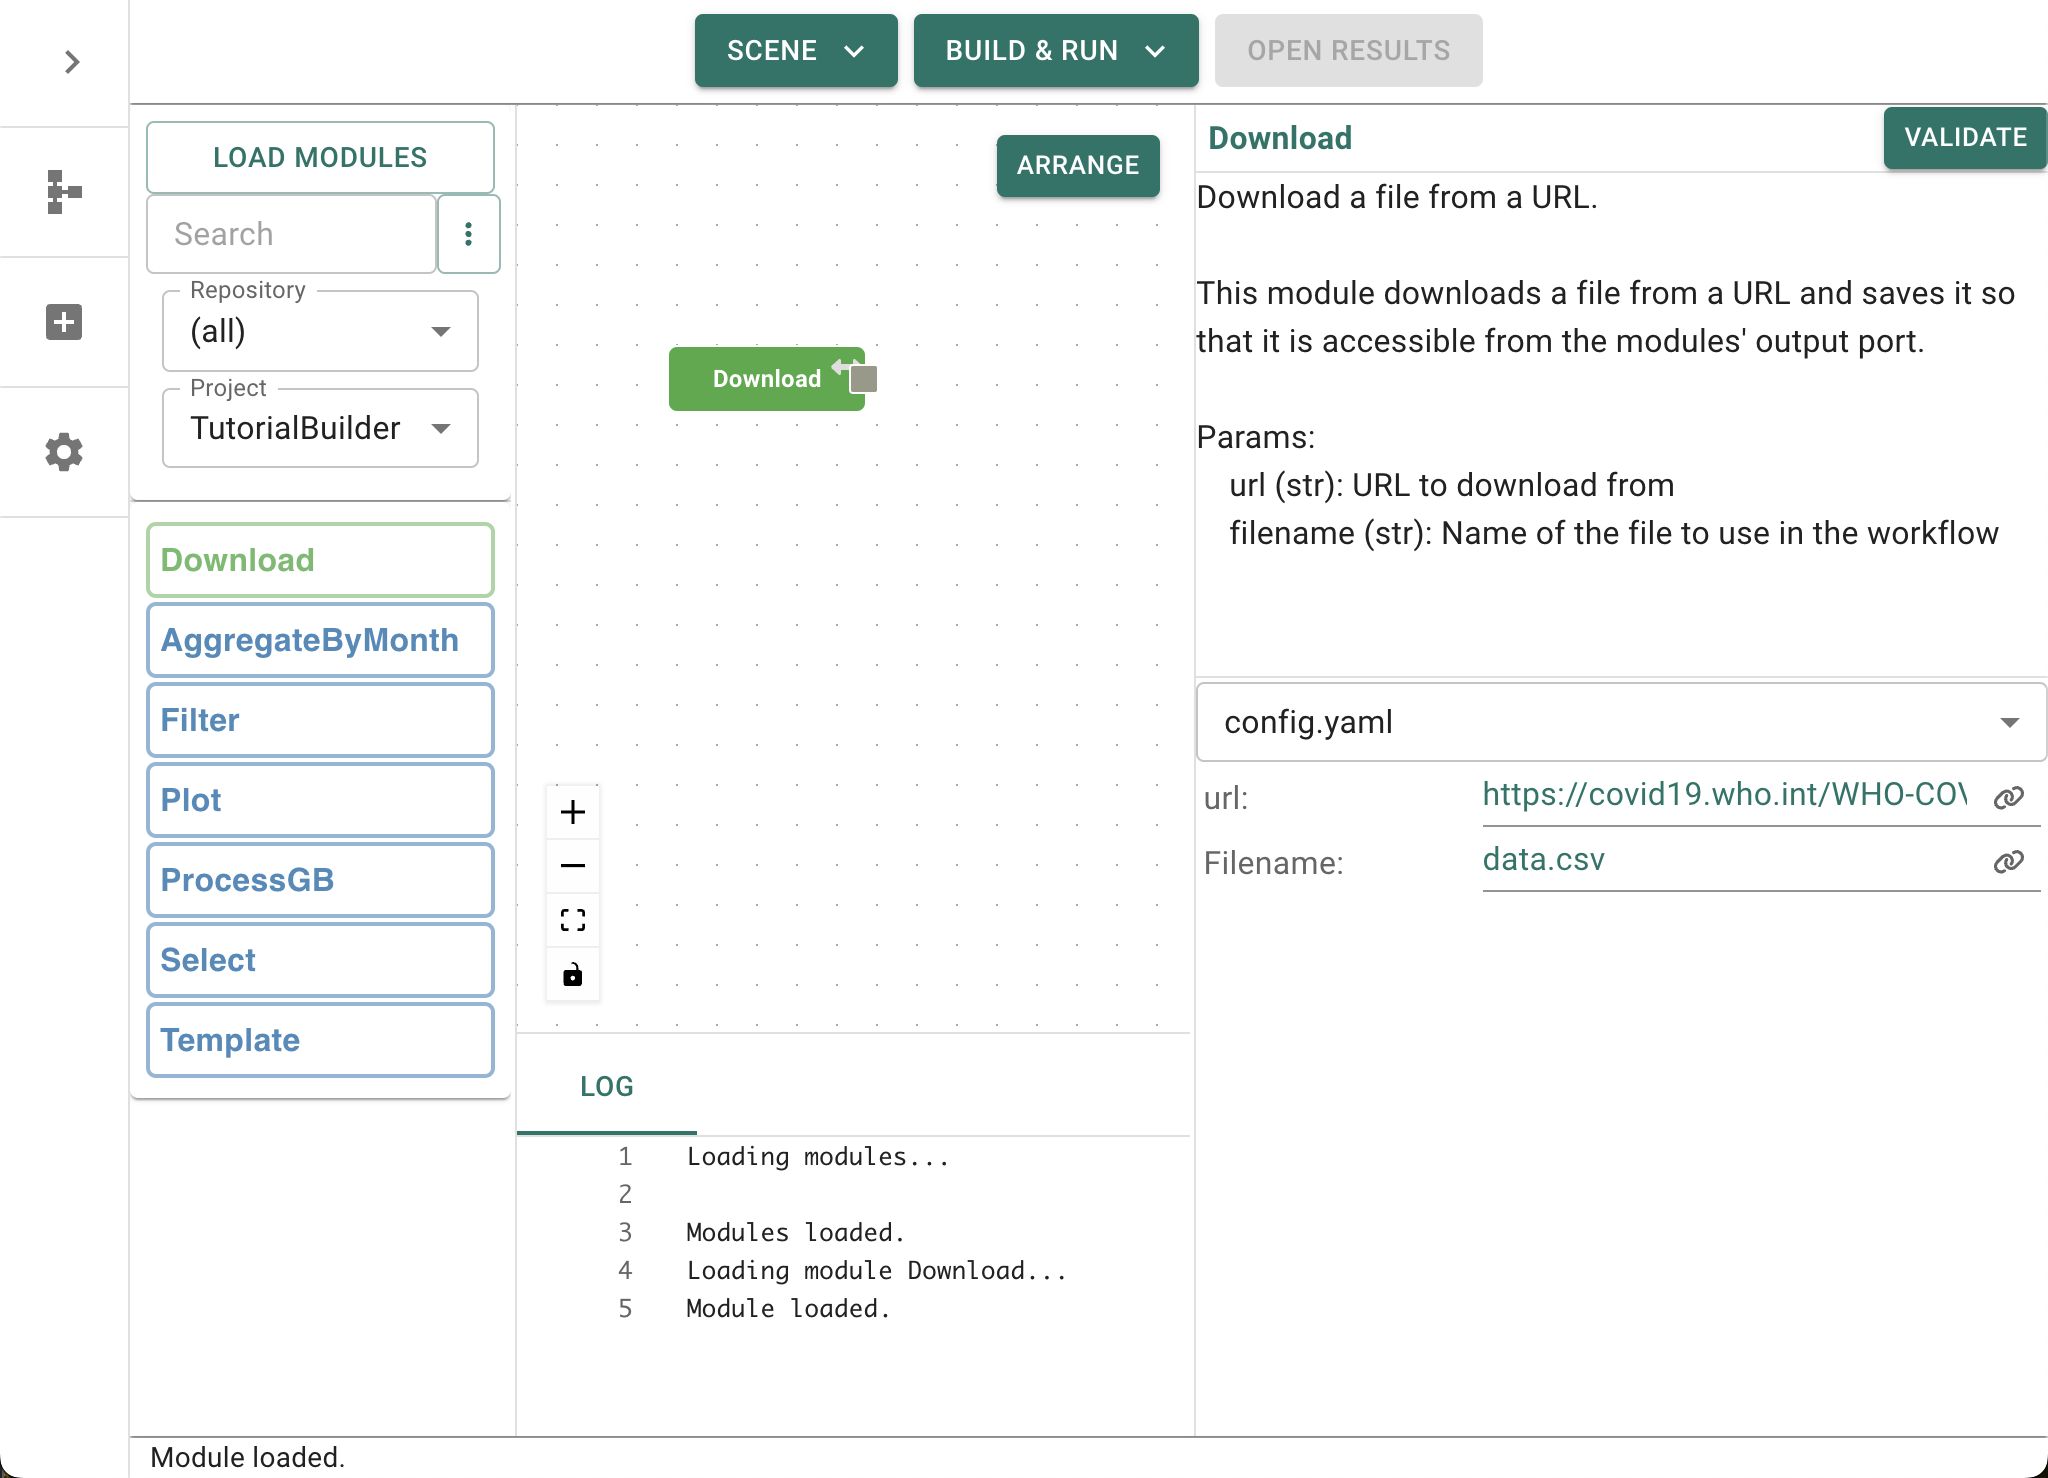
Let’s now add your first module: drag the Download module from the list on the left-hand side of the screeen into the central graph area. This is a simple module that will download a file to your computer. Once it has appeared on the graph you can click on the node/module to edit its parameters. This module has been set up (by default) to download the GRAPEVNE logo from our website. However, we want to change this to download the WHO data.
Modify module parameters#
Click on the module and take a moment to look through the parameters list that is displayed on the right-hand side of the screen. We want to alter both the url and Filename parameters for this test. In the url field, change the URL to the following:
https://srhdpeuwpubsa.blob.core.windows.net/whdh/COVID/WHO-COVID-19-global-data.csv
In addition to changing the URL location, we also want to rename the file after download for convenience. We can do this by editing the filename field (config-params-filename) and changing it to data.csv.
Connect modules together into workflows#
We will now add two mode nodes to the graph. First, add the Filter node. The WHO dataset contains information on many countries, but we want to limit our analysis for the time being. Select the node and notice that there is a Country_code field under config-params-Filters. That is because this module has been set-up to filter based on a list of fields, and field values. We can change this country code, or leave it as it is. For now we will leave it set to its default value of GB (Great Britain).
Next, ensure that the output from your Download module connects to the input to your Filter module. To do this, note that the upper and lower regions of blue modules correspond to input and output ports, respectively. Green modules are distinguished as having only output ports (they do not require inputs to run). Move your mouse until the Out port is highlighted, then click-and-drag a connection between the out-port of the Download module and the in-port of the Filter module.
It’s as simple as that! When the workflow is ‘built’, these modules will pass information to each other so that when the workflow is ‘run’, the files are processed correctly.
We could run the workflow at this point, but we wouldn’t see any output (because we haven’t asked for any). Let’s add one more node and then build our first working workflow.
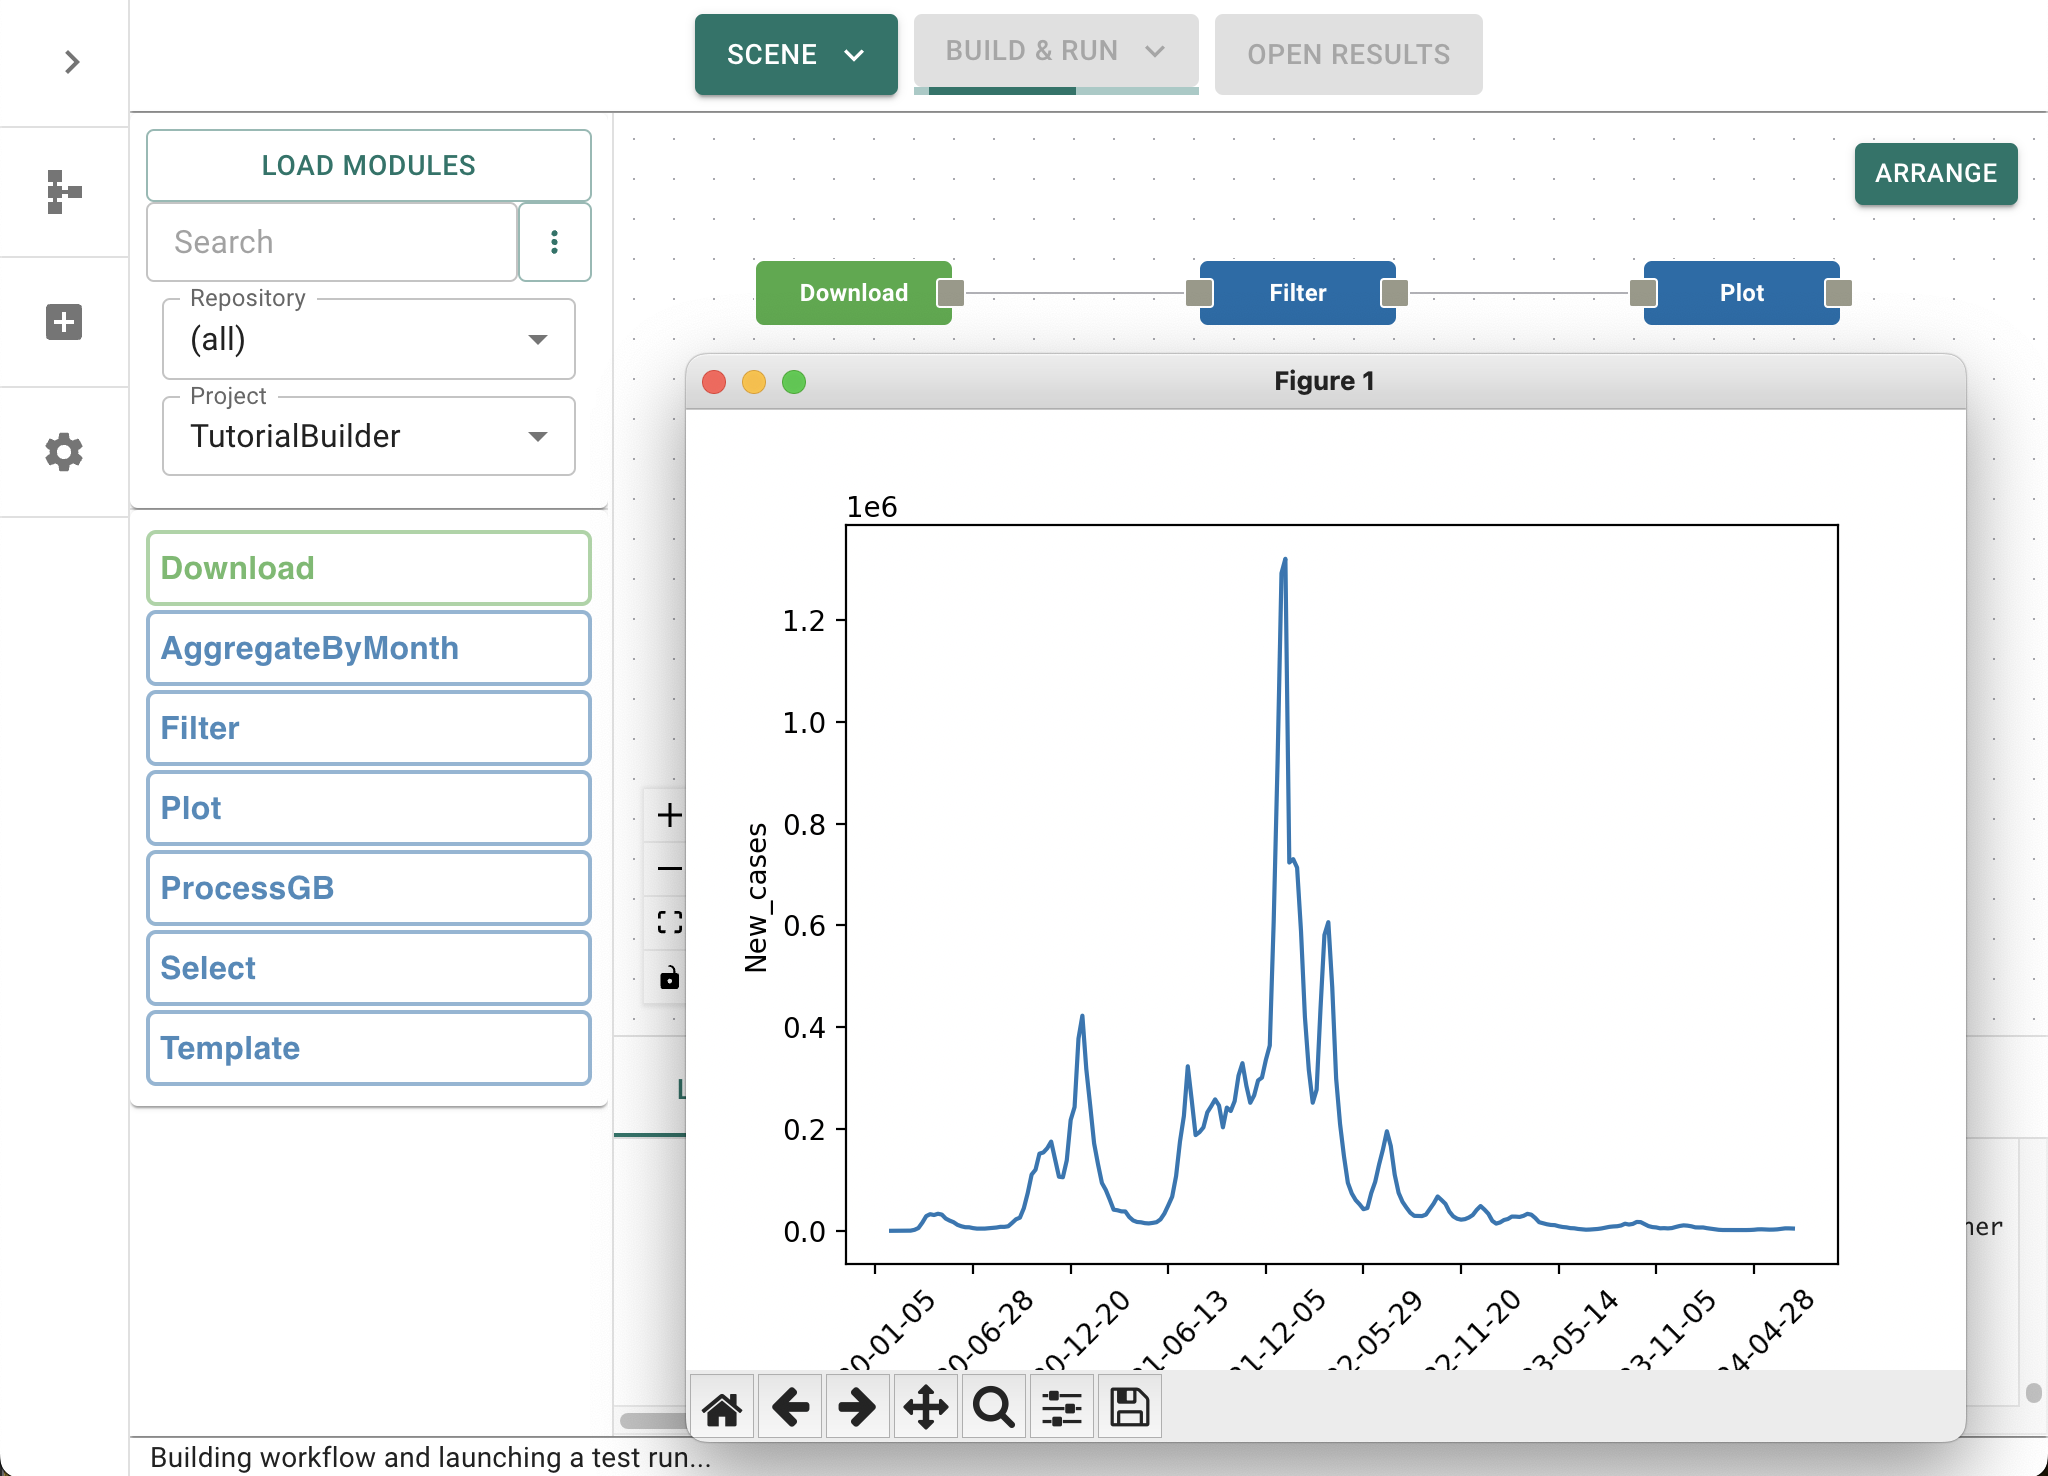
Drag the Plot module from the list available on the left-hand side of the screen into the canvas area, and connect the Filter node to it. Leave its parameters set to the defaults (for now). Now we are ready to (test) run our first workflow…
Test run a workflow#
GRAPEVNE is designed to build workflows into self-contained files that can be shared with others. However, we don’t currently want to do that. Instead, want to ‘test’ the workflow out and see if it does what we expect. To assist us in this, GRAPEVNE provides a Build and Test button (at the top of the screen) that will first build the workflow file(s), and then execute them in a reserved directory.
Before we run our workflow you will need to tell snakemake to make use of conda environments - these are preconfigured as part of our modules, but we need to tell snakemake to use them (as opposed to running natively, through singularity containers, or even in the cloud). To do this, click on Settings, then ensure that Snakemake - arguments says:
--cores 1 --use-conda --force
--cores 1indicates that we are using one CPU core (we can specify more to process our pipeline branches in parallel)--use-condatellssnakemaketo make use ofcondaenvironments (these can be turned off, or replaced withsingularitycontainers, depending on the environment in which we run our workflows).--forceforces snakemake to re-run the full workflow, even if all of the output files are already present. You won’t typically use this, but for the tutorial it is useful as it recreates the diagram each time we clickBuild & Run.
Note
The software packages that we use and specify in our conda environments are available on a range of different platforms. However, it seems as though some of the software that we depend on has not yet been built for the latest Apple Mac hardware. Specifically, if you are using an Apple Silicon device (those with ‘M’-series chips), and are having problems running the tutorial, then try adding CONDA_SUBDIR=osx-64 to the snakemake arguments list (as described above). This will force conda to use the Mac Intel-chip builds on your computer - these should run fine, although may not be as performant as native code.
We are about to run a workflow, but as this is the first time the workflow has run on your computer, it first needs to download the environment files, set-up its runtime environment, and then launch the various steps of your workflow. This can take a few minutes on a first run (but is very much quicker after that).
Try this now: click Build and Test and keep an eye on the Log to monitor progress. This is the perfect time to grab a fresh cup of tea while the environment loads…
Your first graph#
You can monitor the status of your workflow from the Log, but if all goes well then you should see a figure pop-up onto your screen displaying the number of new Covid-19 cases that were reported to the WHO over an extended period of time. Since this plot is being displayed as part of the Plot module, the workflow will pause at this point until you close the figure. Do this now.
Congratulations - you have successfully completed your first test build.
It is at this point that it is worth remembering that despite the ability to visualise data, GRAPEVNE is not designed an interactive data mining and visualisation package. Visualising data is useful as a tutorial example, and can be very useful to periodically inspect the results of analyses, or to manually-inspect pre-processed inputs prior to starting long jobs.
Extending the graph#
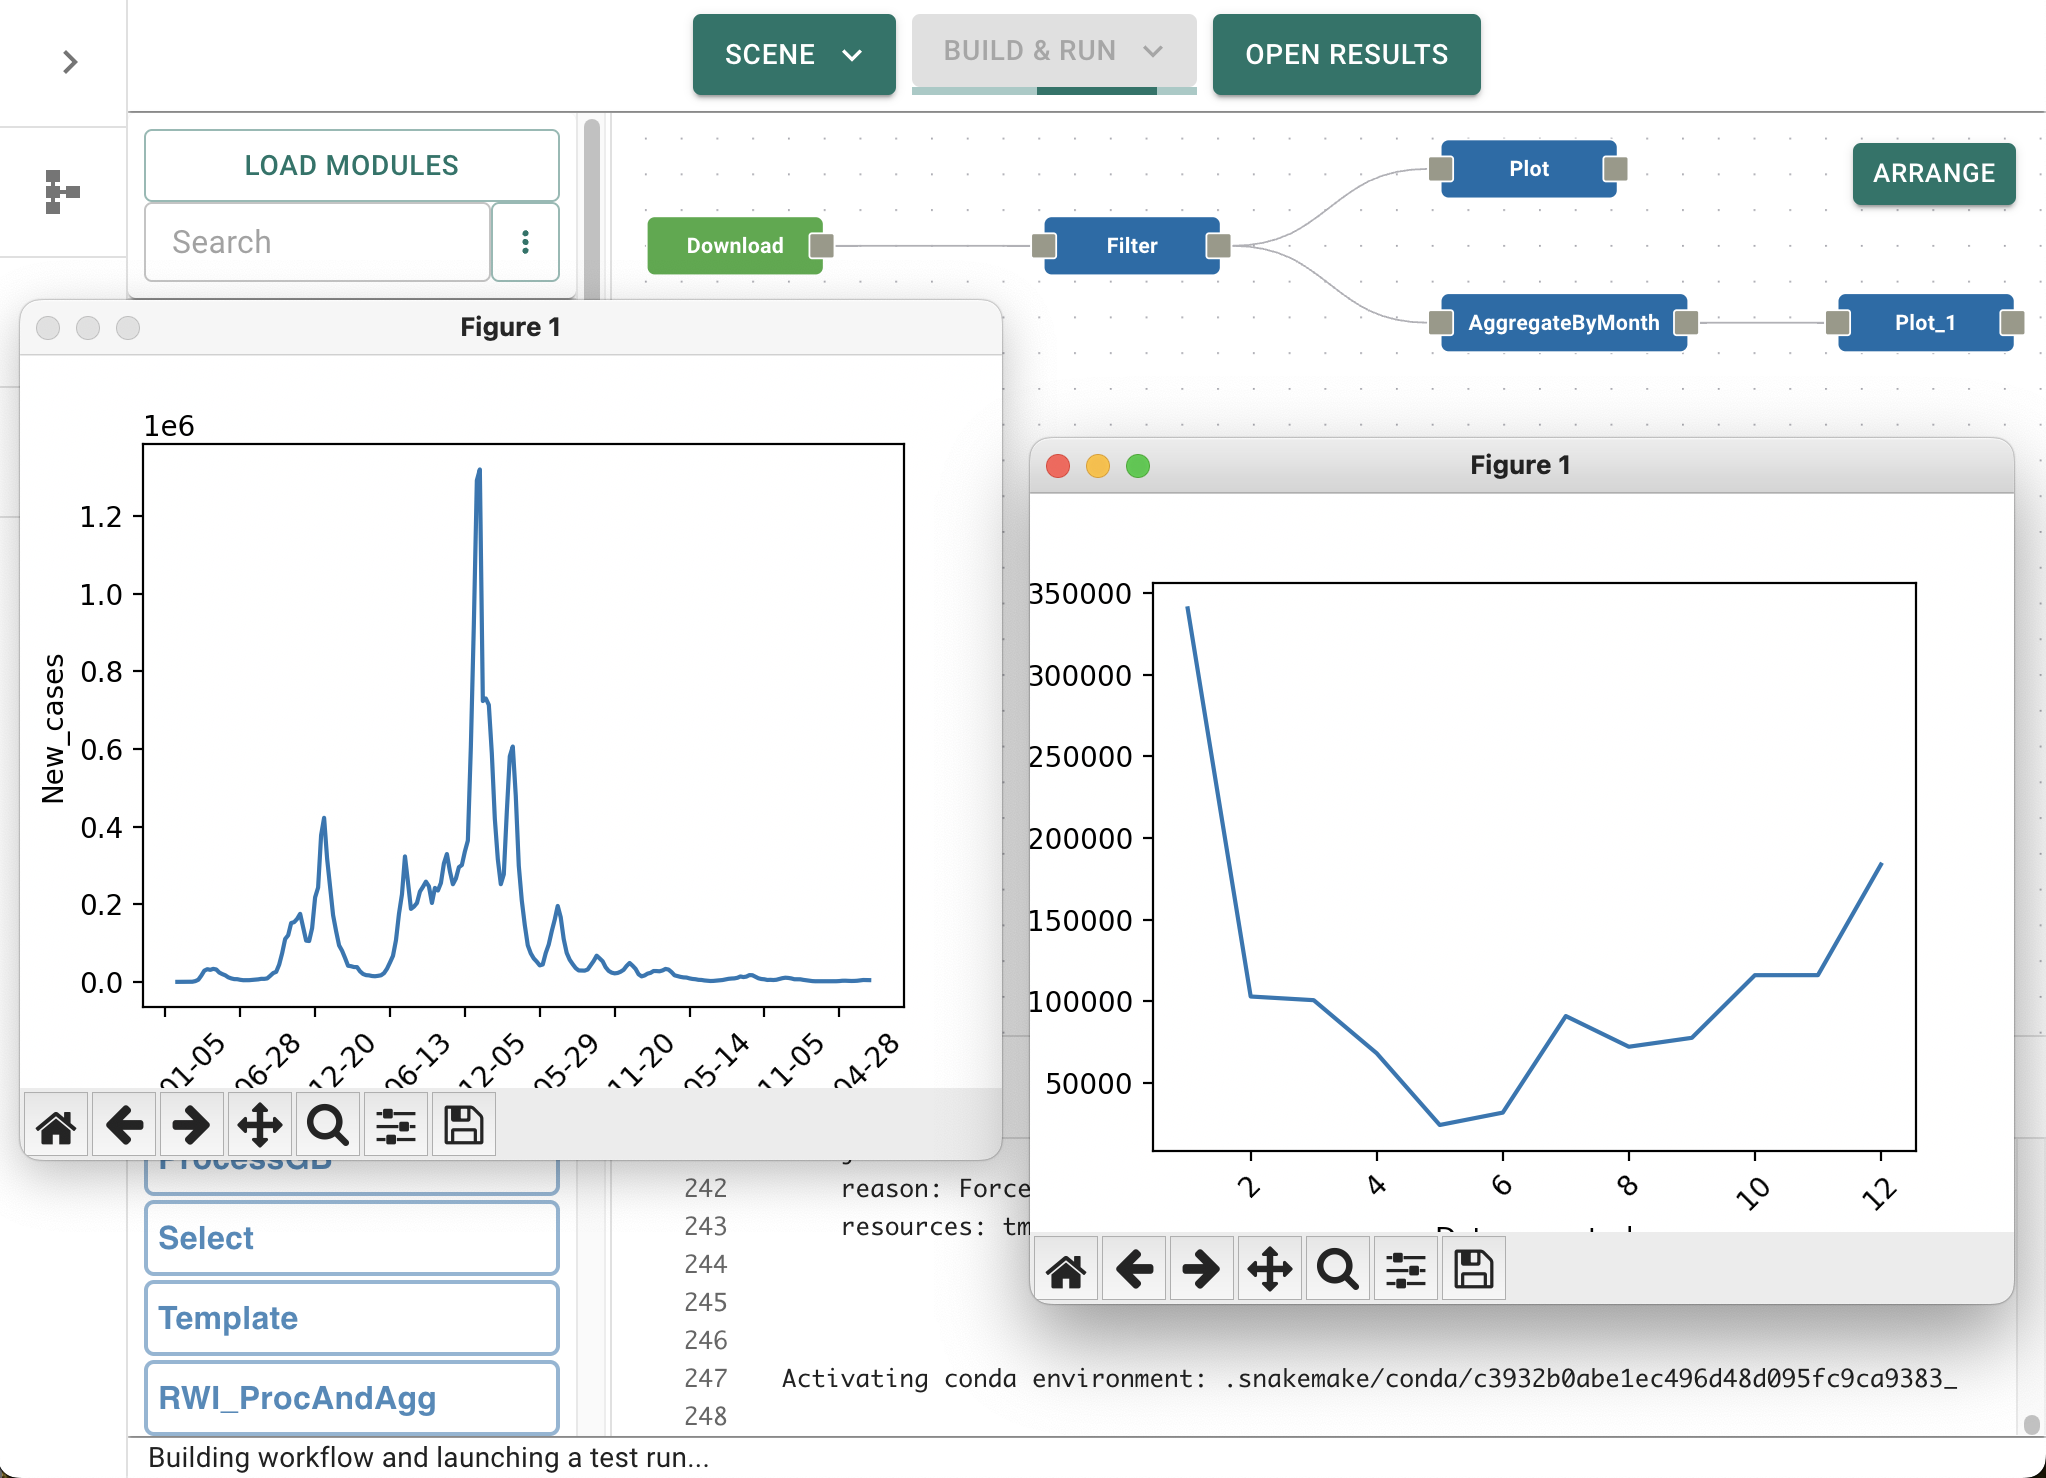
Let us now extend the analysis by considering seasonal variations. With your previous graph entact, add a new node AggregateByMonth and connect the output of the Filter node to it. Note: This means that we are connecting the output of the Filter node to two separate modules: the Plot module, and the AggregateByMonth module. We have therefore demonstrated branching workflows.
You can inspect the parameters of the AggregateByMonth module by clicking on it, although we will leave those parameters set to their defaults for now. Finally, connect a second Plot module to the output of AggregateByMonth.
Run your extended graph#
Click on Build and Test to run your extended graph. Since a lot of the set-up process was completed on the first run (although not all - we have added new nodes), this should execute much more quickly than before.
If, after a few second, both graphs appear on your screen then the two branches of your workflow have run independently and have stopped at the two Plot modules.
If, after a few second, only one graph appears, then this is because you are running snakemake using only a single core, which limits snakemake to run only one module at a time. Closing the graph will allow the second branch to run, and after a few more seconds of processing time, the second graph will appear, revealing the seasonal fluctuations in new Covid-19 cases by month (numbered 1-12 in this case) for our selected country.
Changing parameters#
As you have seen already, changing the parameters of this analysis is extremely easy, you simply have to edit them by clicking on the relevant modules. Try this now by changing the country of interest from GB to another country. Click Build and Test to launch the analysis.
Note
Snakemake will know that the parameters of the analysis have changed and will automatically re-process the necessary steps to produce the required analysis.
Building workflows for use outside of GRAPEVNE#
Although this extends slightly beyond the basic usage of GRAPEVNE, it is useful to consider two scenarios where we may want to build a workflow and distribute it. The first is building the workflow for others to use, outside of GRAPEVNE.
Once you are happy with your workflow you can click Build as Workflow. This will produce a zip file containing a Snakefile (the default Snakemake workflow format), and the accompanying configuration files that to allow your workflow to be run outside of GRAPEVNE.
For example, to run your newly created workflow called build.zip outside of GRAPEVNE, simply unzip it, move into the build folder launch the workflow by typing ./run.sh.
This will launch the same series of steps as the Build and Test button, but without needing the GRAPEVNE application. There is also a ./build_container.sh script for creating a container from the provided Dockerfile, and ./run_workflow.sh which launches the container. These can be run locally, or remotely (i.e. cloud compute), as required.
Building workflows for use as modules#
The second basic scenario of workflow usage is using GRAPEVNE to create workflows composed of hierarchies of modules. This requires us to be able to make module from existing modules. Thankfully this is incredibly straightforward since the only special requirements to build a module instead of a workflow is that it contains only a single output. Clicking Build as Module creates a module, which is identical to the Build as Workflow button, except that we do not include the launch scripts, as modules are not intended to be launched independently. Once you build the module and unzip it, GRAPEVNE is able to read the configuration file and load the module ready for use. If all of the input ports were connected then the resulting module will have no input ports itself, but if some input ports were left unconnected, then these will be exposed in the editor for use.
Summary#
You are now able to build a workflow to either
distribute to others for use, or
use as a module in another workflow
Indeed, it is this form of hierarchical modularization that makes GRAPEVNE so powerful. However, to demonstrate this we will want to set-up our own repository for testing (which we discuss in the next set of tutorials).
Wait, but why is the workflow so slow on a first run?#
You may be wondering why the workflow was so slow to execute on its first run. After all, it was simply reading a file, filtering it, and plotting the result. The answer is that each module was set up to operate within a conda environment. These configurations come with the modules so that you don’t have to worry about them when building your workflows. Essentially, the conda environments set-up an isolated environment and download all of the necessary software to execute the contents of each module in a highly reproducible manner. Further details of conda environments and how snakemake / GRAPEVNE makes use of them are available in the next set of tutorials.